In response to a need for finer detail in AMI collector site locating projects, an ArcGIS Server-based web site has been created to solve a mapping problem at a local electric utility. This project aims to replace a trial and error system of selecting sites for centralized collecting devices.
The entire project was built and run using Amazon EC2 cloud computing resources. This project will help predict the performance of the communication technology within the Automated Meter Infrastructure system. The meters can communicate with each other up to 1200 feet and “hop” through up to 8 meters ultimately returning read information to a number of master “Collector Meters”. This will help select locations for these collector meters.
The entire project was built and run using Amazon EC2 cloud computing resources. This project will help predict the performance of the communication technology within the Automated Meter Infrastructure system. The meters can communicate with each other up to 1200 feet and “hop” through up to 8 meters ultimately returning read information to a number of master “Collector Meters”. This will help select locations for these collector meters.
Above is an embedded version of the meter densities map that serves as the focal point of this project. The full web map can be found here. This map helps users visualize areas of higher and lower meter densities for siting of Collector Meters and Central Fixed Collectors. This map helps not only visualize the trends, but also provides specific information about densities and proximity.
The above video helps to describe the initial need for such an implementation.
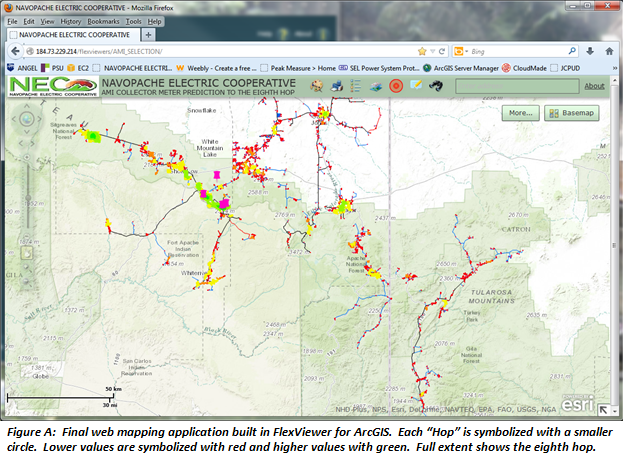
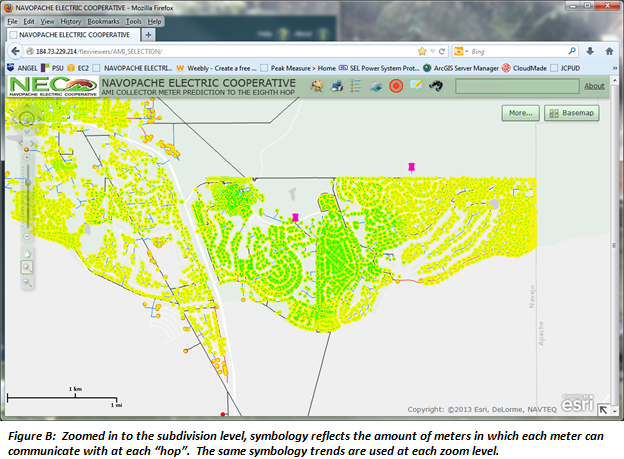
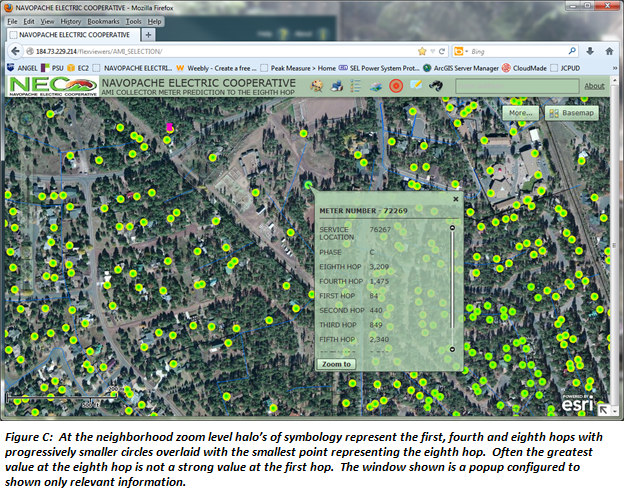
Figure A, B, C and D show the results of the python code symbolized and served as a Web Mapping Service through FlexViewer for ArcGIS. This code is fairly simple, but loops through a data set of 42,500 records selecting and writing values to eight separate fields. This code loops through a set of points and writes the quantity of points within 1200 feet of each point. Before moving to the next record, the same selection will be performed by selecting and writing a quantity of points within 1200 feet of the first selection set. This process will be completed 8 times. To run the code, it was necessary to scale the Amazon EC2 instance up to an M3.2XLarge site for greater processing capacity. The final run took about 22 hours to complete.
Figure A, B, C and D show the results of the python code symbolized and served as a Web Mapping Service through FlexViewer for ArcGIS. This code is fairly simple, but loops through a data set of 42,500 records selecting and writing values to eight separate fields. This code loops through a set of points and writes the quantity of points within 1200 feet of each point. Before moving to the next record, the same selection will be performed by selecting and writing a quantity of points within 1200 feet of the first selection set. This process will be completed 8 times. To run the code, it was necessary to scale the Amazon EC2 instance up to an M3.2XLarge site for greater processing capacity. The final run took about 22 hours to complete.
Due to the size of the dataset and amount of time needed to process the script, it was decided to perform the spatial analysis within the cloud server environment and display the results through a web based application. The meter information is not static but it is not extremely dynamic either. Meters may be added and removed from the system but the changes should not affect the final product greatly. Being such an automated process, this analysis can be repeated on a monthly basis or as data changes.
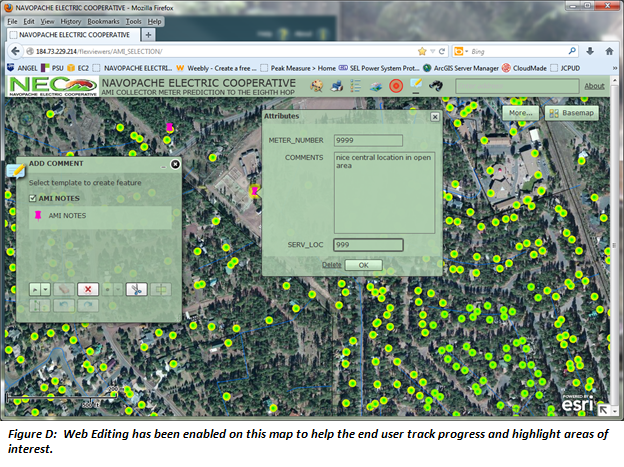
This mapping service has been published using a tiled, cached approach. This improved the viewing experience greatly. This performance is most noticeable in the speed of drawing and panning within the web application. Editing has also been included to enable the end user to drop notes on key features and track installments of “Collector Meters”. A feature enabled service was published to meet this need, shown in figure D.
This mapping service has been published using a tiled, cached approach. This improved the viewing experience greatly. This performance is most noticeable in the speed of drawing and panning within the web application. Editing has also been included to enable the end user to drop notes on key features and track installments of “Collector Meters”. A feature enabled service was published to meet this need, shown in figure D.
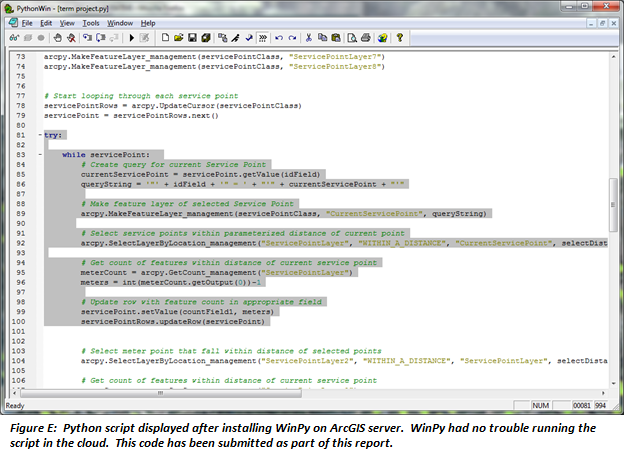
WinPy was installed on the ArcGIS Server built through Cloud Builder. Figure E is a screenshot of the installment on the instance with the Python script open. Scaling the Amazon Instance was necessary to run this large script and to build the tiles for the cached map service.
This project has already become an integral application for choosing collector meter locations throughout the entire electrical distribution system, response to the speed and usefulness has been positive. Surely this is only the beginning of how GIS and cloud and server based mapping applications can help save time, energy, and money in this Automated Meter Infrastructure program.
